The Log Analyzer is a new PeopleTools 8.55 tool that helps you get more information from App Engine trace files. Log Analyzer is specific to analyzing App Engine traces. It feels like a simplified version of TraceMagic (a good thing!). If you have used TraceMagic for PeopleCode, or the Trace2SQL utility to parse .tracesql files, Log Analyzer feels like the two tools combined.
Trace Settings
You need to set the App Engine trace settings to at least these values in the psprcs.cfg file for the Log Analyzer to work:
- Trace SQL: 3
- Trace PC: 64
If you are using Config Manager, that translates to these options:
PeopleCode Trace
Trace Start of Programs
App Engine Trace
StepSQL
Last, you can set them at the process level:
-TRACE 3 -TOOLSTRACEPC 64
You can use higher trace values, but these are the minimum for the Log Analyzer to correctly parse your files. Make sure to specify the App Engine SQL trace. If you select the PeopleTools SQL trace, you won’t get an *.AET file when the app engine runs. You can generate a SQL trace (.tracesql) and an App Engine trace (.AET). But at a minimum, you need an *.AET file. Log Analyzer also uses the .TRC PeopleCode trace file.
Log Analyzer GUI
The Log Analyzer tool is a separate java application located under PS_HOME\bin\client\winx86\AELogAnalyzerTool. To launch the tool, run the runTraceAnalyzer.bat batch script. After launching the tool, you’ll see an empty screen. You need to load in an *.AET file.
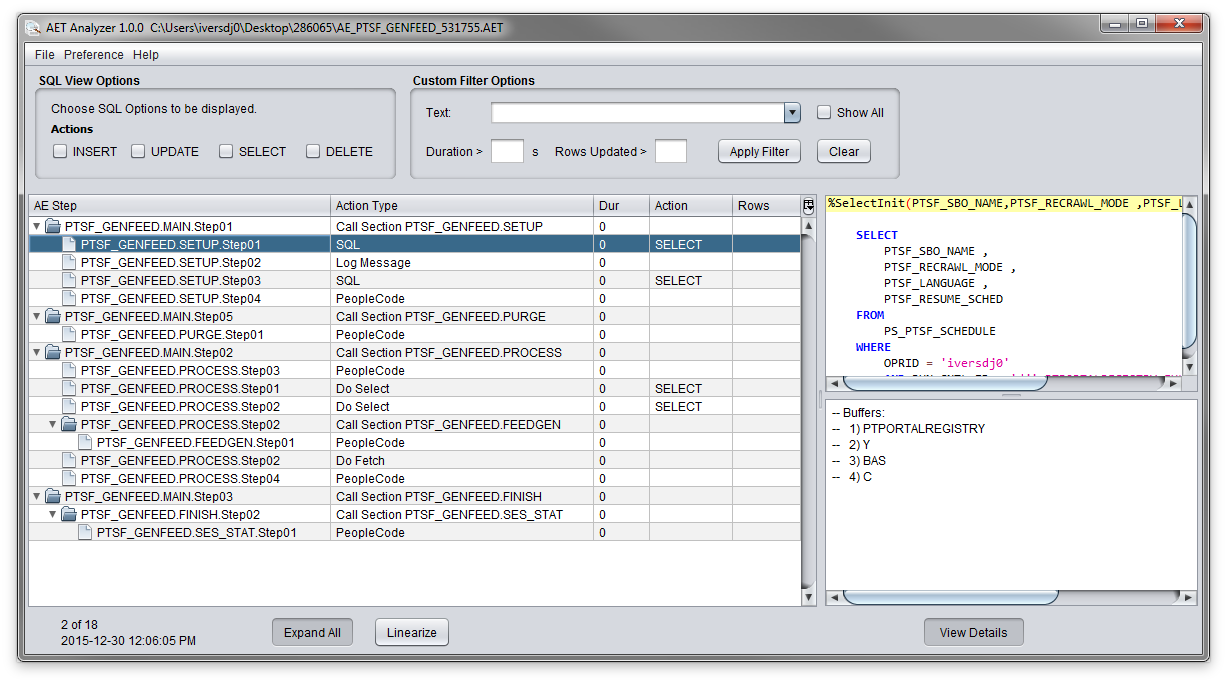
Once you load an *.AET trace file, the Log Analyzer will display the heirarchy of the trace program in the lower window. You can expand each section and click on the SQL steps. To view the associated SQL and parameters, click on the “View Details” button. You can also look at the trace in execution order (without the parent/child nesting) by clicking on the “Linearize” button.
Load PeopleCode
If you generate a PeopleCode .TRC trace file, you can import the .TRC file into Log Analyzer. If the trace file has the “Trace Start of Programs” lines (value 64), Log Analyzer will correlate the PeopleCode statements to the app engine step. In the lower window, you can click on the PeopleCode step and view the PeopleCode much like the SQL.
Apply Filters
Log Analyzer has different ways to filter and view your trace file. There are four options to view the different SQL operations: insert, select, update, delete. You can also filter the log output based on a text value, the duration of the step (useful for tuning), or by the number of rows updated.
Log Analyzer feels like a new tool. It functions are still limited (you can filter, but not search), but I think it will be a great tool to add for admins and developers. If you have used TraceMagic, Log Analyzer will be easy to pick up.
Pingback: 8.55 – Log Analyzer | Dinesh Ram Kali.