Heartbeat is a lightweight utility from Elasticsearch that can help you monitor the status and uptime of different applications. In our case, we can use Heartbeat to tell us if a PeopleSoft environment is available or not. Using HTTP monitors, Heartbeat can request a specific URL and evaluate the response. While other utilities can do the same thing, Heartbeat was built to send data to Elasticsearch (and Opensearch) and comes with delivered dashboards. This makes is easy to build a quick dashboard to show our PeopleSoft environment status.
Running Heartbeat
There are multiple ways to run Heartbeat, but for this post we’ll run it as a container with podman-compose. You will also need an Opensearch or Elasticsearch instance to send the Heartbeat data to. If you don’t have either system running and want a quick installation, use this post to get you started.
First, create (or modify) a compose.yaml to setup our Heartbeat container.
$ cd ~
$ vi compose.yaml
We will use the heartbeat-oss image and the 7.12.1 release since it is compatible with Opensearch.
version: '3'
services:
  heartbeat:
    image: docker.elastic.co/beats/heartbeat-oss:7.12.1
    container_name: heartbeat
    environment:
      - setup.kibana.host=opensearch-dashboards:5601
    volumes:
      - /home/opc/heartbeat/heartbeat.docker.yml:/usr/share/heartbeat/heartbeat.yml:Z
      - /home/opc/heartbeat/data:/usr/share/heartbeat/data:Z
    command:
      - "-e"
      - "--strict.perms=false"
Create the heartbeat/data/ directory and a heartbeat/heartbeat.docker.yml file.
$ mkdir -p heartbeat/data
$ vi heartbeat/heartbeat.docker.yml
We will create a simple icmp monitor in heartbeat.docker.yml so we can verify the container starts properly. Also set the Elasticsearch or Opensearch target system and credentials. We’ll encrypt the password later.
heartbeat.monitors:
- type: icmp
  name: containers
  schedule: '@every 30s'
  hosts:
    - heartbeat

output.elasticsearch:
  hosts: ['https://opensearch-node1:9200']
  username: 'admin'
  password: 'admin'
If you are using a newer release of Opensearch, we need to tell Opensearch to return an Elasticsearch-compatible version number. This will prevent template loading errors with Heartbeat.
$ curl -XPUT -ku admin:admin -H 'Content-Type: application/json' https://localhost:9200/_cluster/settings -d'{"persistent": {"compatibility": {"override_main_response_version": true}}}'

{"acknowledged":true,"persistent":{"compatibility":{"override_main_response_version":"true"}},"transient":{}}
Start the container.
$ podman-compose up -d && podman-compose logs -f heartbeat
In our compose.yaml file, we added the line setup.kibana.host=opensearch-dashboards:5601 which tells Heartbeat to install an index template for the data that we are sending to Opensearch. The template will ensure fields are the correct types (integers, strings, ip addresses, etc).
View Heartbeat Data
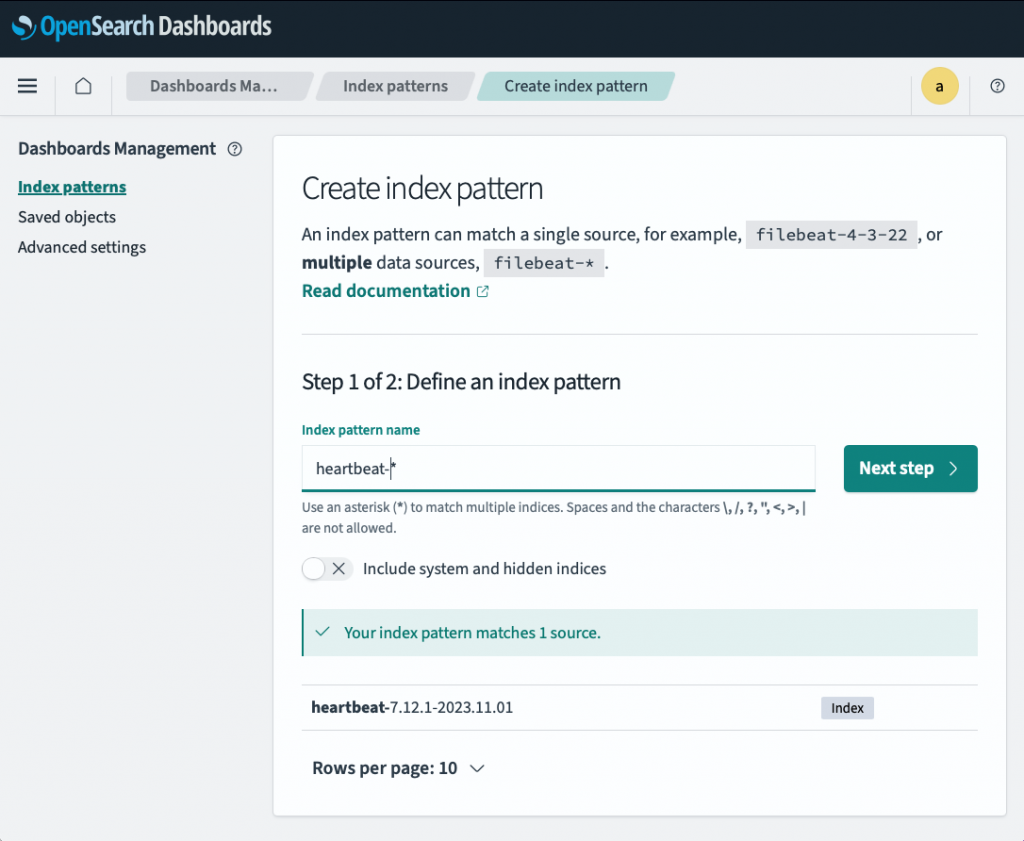
Once Heartbeat starts, it will run the monitors listed in heartbeat.docker.yml and send the results to Opensearch. Log into Dashboards (http://<server>:5601) and navigate to Dashboards Management > Index Patterns to create a new Index Pattern for our heartbeat-* indexes.
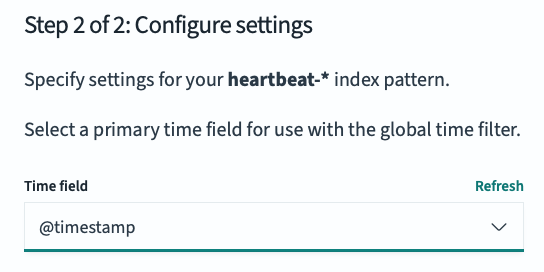
Select @timestamp for the Time Field and click “Create index pattern”.
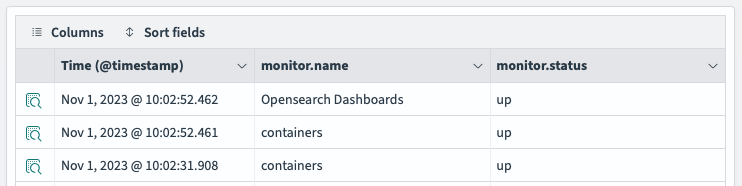
Next, we can view our Heartbeat data under the “Discover” page. Make sure heartbeat-* is selected for the Index Pattern.
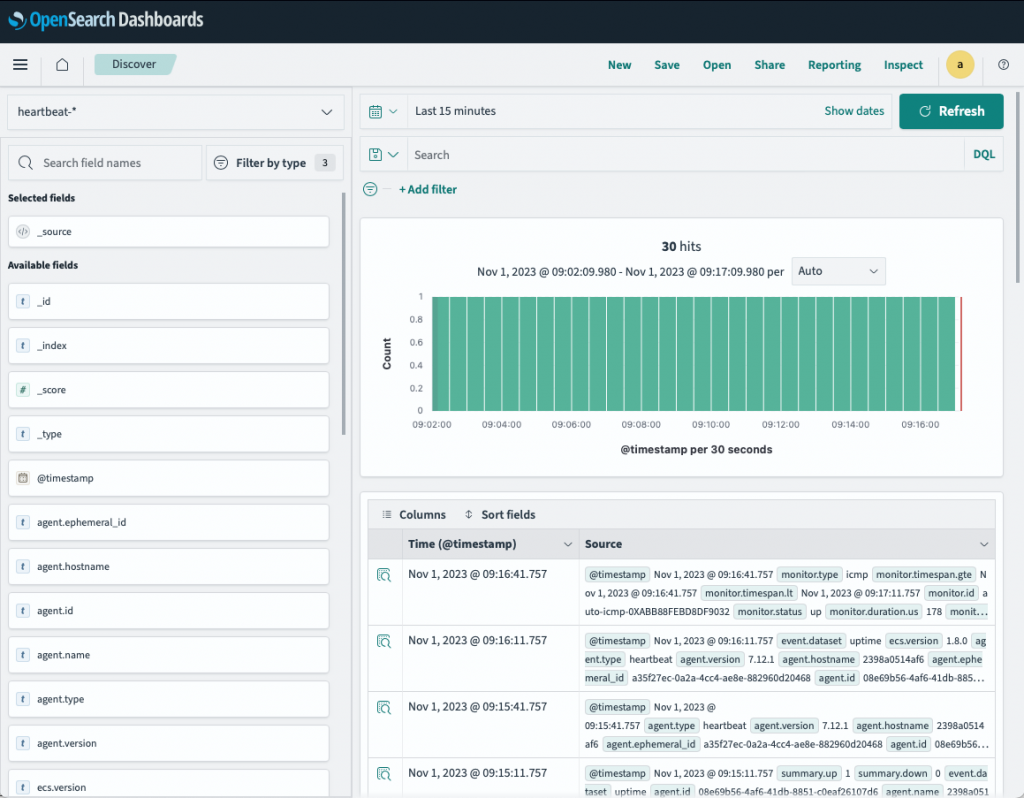
While this is cool to see, we only have one monitor running and it’s pinging our “heartbeat” container to see if it’s running. We need to add more monitors to make it work for a PeopleSoft Status Dashboard.
HTTP Monitors
Heartbeat supports three types of monitors out of the box: ICMP (or ping), TCP, and HTTP. We used the ICMP type to check our Heartbeat container. We will start using the HTTP type check our Opensearch Dashboards endpoint is up.
Open the heartbeat.docker.yml file and insert this monitor after the containers monitor.
- type: http
  schedule: '@every 60s'
  id: search-dashboards
  name: 'Opensearch Dashboards'
  username: admin
  password: admin
  urls:
    - http://opensearch-dashboards:5601/api/status
  check.response:
    status: [200]
    json:
      - description: 'Dashboard Status'
        condition:
          equals:
            status.overall.state: green
The http monitor will run every minute and run a GET request against the /api/status endpoint. That endpoint returns a large JSON document with status for many different services. We only care about the main status, so we use the check.response.json section to drill down to the specific field we want to validate. We also pass in credentials to log into Dashboards.
Save the file and reload the Heartbeat container.
$ podman-compose down heartbeat && podman-compose up heartbeat -d
If you go back to Dashboards and refresh the Discover page, you will see our new monitor shows up with the latest status.
PeopleSoft HTTP Monitors
Now for the fun part, using Heartbeat to check our PeopleSoft systems. We could check just the web server by looking at the login page, but that doesn’t tell us if the app server is running. A more practical check is if someone can log in to verify the web and app servers are running, and the login is successful. To do this, you will need to create a basic account in PeopleSoft that only has enough access to log in.
When you log into PeopleSoft, a successful login will redirect the browser to the iScript WEBLIB_PTBR.ISCRIPT1.FieldFormula.IScript_StartPage. That means our monitor will need to POST credentials to the login page, wait for a redirect, and then validate if the redirect is to the iScript. Here is how that looks with Heartbeat:
- type: http
  schedule: '@every 60s'
  id: pia-lmdev
  name: 'ELM Devevelopment'
  urls:
    - 'https://lmdev.psadmin.io/psp/ps/EMPLOYEE/ERP/'
  max_redirects: 2
  check.request:
    method: POST
    headers:
      'Content-Type': 'application/x-www-form-urlencoded'
    # URL Encoded
    body: "userid=HEARTBEAT&pwd=password"
  check.response:
    body: WEBLIB_PTBR.ISCRIPT1.FieldFormula.IScript_StartPage
Unlike the Dashboards HTTP monitor, we don’t use the username and password fields. Those are for sites that support BASIC authentication. With PeopleSoft, the credentials are URL encoded (that’s important for passwords) and passed in the POST form body to PeopleSoft. We then allow PeopleSoft to return a redirect and we check each response if it is sending us to the iScript. If it is, we know it was a successful login.
It is important to URL encode the password, as special characters will break the check. There are many places online that can help with encoding your password.
You can also check the Integration Gateway to make sure it’s active.
- type: http
  schedule: '@every 60s'
  id: igw-lmdev
  name: 'ELM Devevelopment - Gateway'
  urls:
    - 'https://lmdev.psadmin.io/PSIGW/PeopleSoftListeningConnector'
  check.response:
    body: ACTIVE
You may also want to check your Elasticsearch or Opensearch clusters.
- type: http
  schedule: '@every 60s'
  id: search-elasticsearch
  name: 'Elasticsearch
  username: 'esadmin'
  password: 'esadmin'
  urls:
    - 'https://elasticsearch.psadmin.io:9200/_cluster/health'
  check.response:
    status: [200]
    json:
      - condition:
          equals:
            status: green
You can use the Dashboards check above for Kibana or Insights (they are all the same tool – just different names).
We can also monitor if a specific web server is up and running by requesting the /index.html page and verifying the response code was 200
- type: http
  schedule: '@every 60s'
  id: web-servers
  name: 'Web Servers'
  hosts: [ "lmdev.apps.ps.oraclevcn.com:8000" ]
  check.response:
    status: [200]
With the HTTP monitor, you can monitor quite a bit of the PeopleSoft stack. If you want to try something new, use your browsers “Network” tab in the Debug Tools to see what the HTTP request/response is. That’s a great way to see what is happening behind the browser and will help you mock up the HTTP monitor in Heartbeat.
You can also use the TCP monitor to check if an application server is running. There are a number of processes that make up an application server, but a simple check is seeing if the JSL process is responding to connections.
- type: tcp
  id: app-servers
  name: 'App Servers'
  schedule: '@every 60s'
  hosts: [
    "tcp://lmdev.apps.ps.oraclevcn.com:9033"
    ]
Before we build our Uptime Dashboard, we should protect the passwords in our heartbeat.docker.yml file.
Heartbeat Keystore
Heartbeat (and all the other Beats from Elastic) support a keystore out of the box. It’s easy to use and allows you to hide passwords from people who might be able to read your config file.
First, we need to create a new keystore file. We will create the keystore from inside our Heartbeat container. The keystore will be created in a directory that is volume mounted to our host file system. This allows you to backup the keystore (and config files) so you don’t have to recreate the everything when the container restarts.
$ podman-compose exec heartbeat /bin/bash
bash-4.2$ heartbeat keystore create
Created heartbeat keystore
To add passwords (or any value) to the keystore, we use the keystore add command from inside the container.
bash-4.2$ echo 'admin' | heartbeat keystore add OS_ADMIN --stdin
Successfully updated the keystore
The Opensearch admin user password is now stored in the keystore under they key OS_ADMIN. We can reference that in our config files using this syntax: "${OS_ADMIN}"
Update the heartbeat.docker.yml file in the two places we have the password hard-coded.
...

- type: http
  schedule: '@every 60s'
  id: dashboards
  name: 'Opensearch Dashboards'
  username: admin
  password: "${OS_ADMIN}"

...

output.elasticsearch:
  hosts: ['https://opensearch-node1:9200']
  username: 'admin'
  password: "${OS_ADMIN}"
  ssl.verification_mode: 'none'
Verify the keystore is available on the host machine. Then you can restart the Heartbeat container to test our encrypted password.
$ ls heartbeat/data/*.keystore
heartbeat/data/heartbeat.keystore

$ podman-compose down heartbeat && podman-compose up heartbeat -d
Your monitors should still work after using the encrypted passwords with the keystore.
Uptime Dashboards
With our monitors defined and producing data, we can start building visualizations in Opensearch Dashboards or Kibana.
Navigate to Visualise and select “Create new visualization”. Select the “TVSB” type.
One tricky part of the building a simple up/down visualization is that we only need the last check from Heartbeat. Most of the visualizations are designed to aggregate data by count, average, etc and not just a single row. To get a single row, we need to use two aggregations together to limit the data.
In the TSVB visualization page:
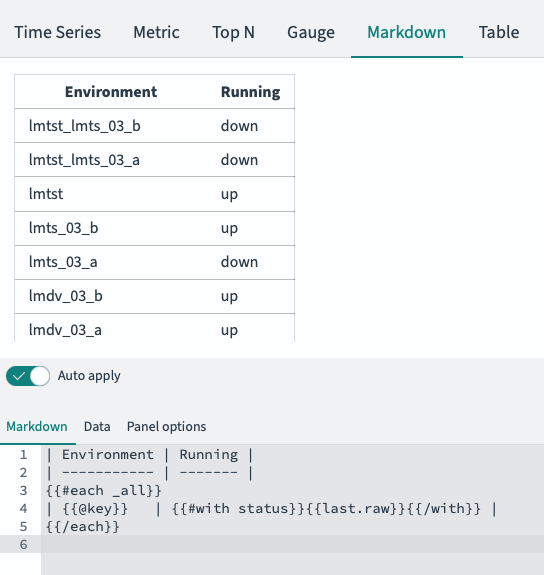
- Select “Markdown” for the visualization style.
- Enter this text in the Markdown panel. This will be blank to start, and will show us sample output after we configure the query.
| Environment | Running |
| ----------- | ------- |
{{#each _all}}
| {{@key}} |{{status.last.raw}} |
{{/each}}- Select the Data panel
- Enter
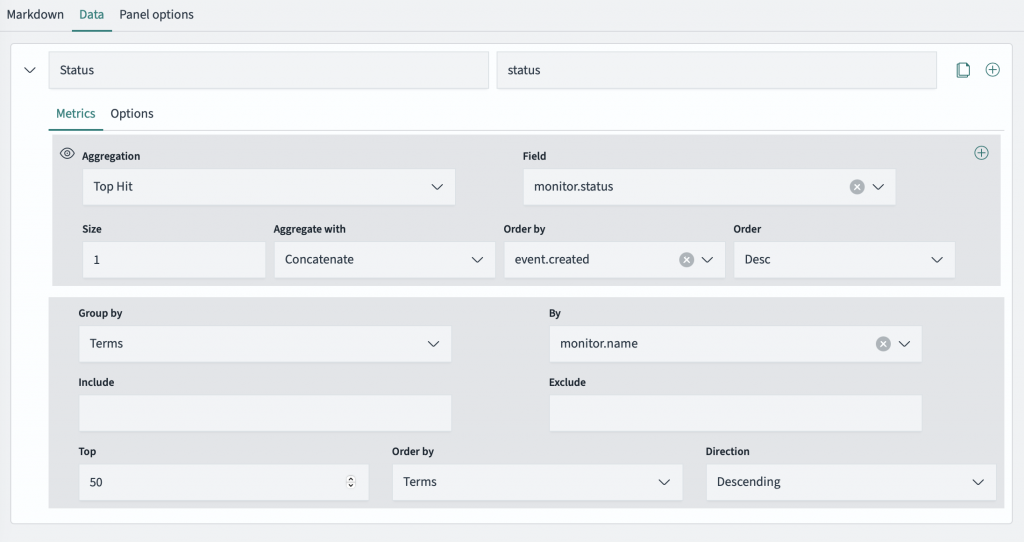
Statusfor the Label andstatusfor the Variable Name. Thestatusvariable is used by the Mustache code we used in the Markdown block. - Select “Top Hit” for the first Aggregation
- Choose “monitor.status” for Field
- Enter
1for Size - Select “Concatenate” for Aggregate with
- Select “event.created” for Order by
- Choose “Desc” for Order
- Choose “Terms” for Group by
- Enter
monitor.namefor By - Enter
50for Top - Select “Terms” for Order by
- Select “Descending” for Direction
The Data panel will look like this when you are done.
The visualization will look something like this. The Running column might start out with 0 or 1 initially, but after a few checks the monitor.status field will start showing “up” and “down”. Save the visualization as “Environment Status”.
One issue with this chart is that it shows everything: web servers, app servers, PIA login checks, servers pings. We can break down this visualization into separate charts, one for each type.
In the Panel Options panel, you can add a “Panel filter”. You can use any field to filter, but if you look at the sample monitors above I intentionally added a prefix to the id: field. We’ll use this prefix to separate the results.
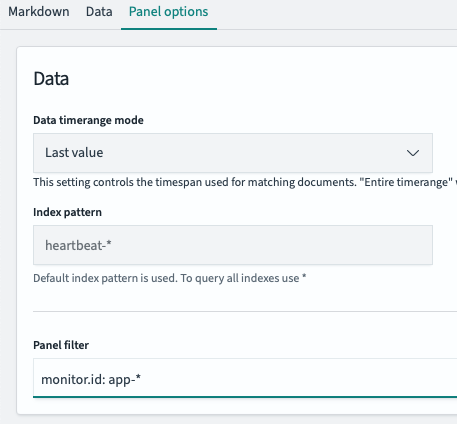
monitor.id: pia-*: Environment Statusmonitor.id: app-*: App Server Statusmonitor.id: web-*: Web Server Statusmonitor.id: search-*: Search Server Statusmonitor.type: icmp: Server Status
Save each as a new visualization use for our dashboard.
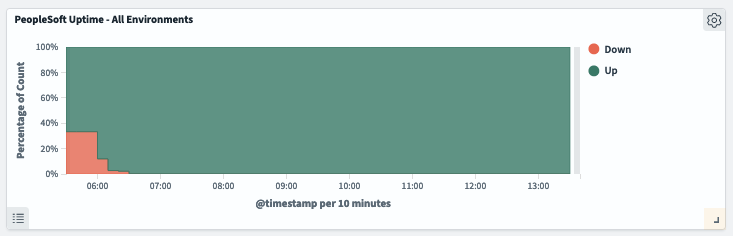
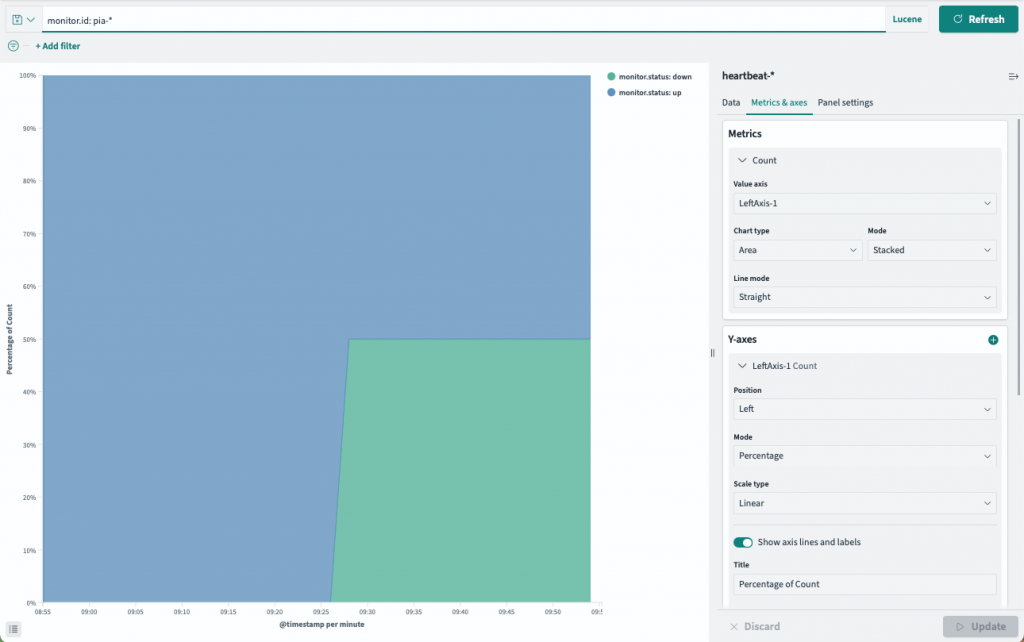
The last visualization we’ll make it a graph showing the historical status of our Environment uptime.
- Create a new Area visualization with
heartbeat-*as the data source. - Enter
monitor.id: pia-*for the search filter. - Add an X-axis Bucket and use
@timestampfor the Date Histogram. - Add another Bucket and select “Split Series”.
- Choose Filters for the Sub Aggregation
- Add
monitor.status: downandmonitor.status: upfor Filters. - Under the Metrics & Axes panel, expand “Y-axes”.
- Change the Mode to “Percentage” and click “Update”.
- Save the visualization as “Environment Status History”.
With our visualizations created, we can create our status dashboard. Navigate to Dashboards and create a new one. Add the visualizations we created so the dashboard looks like this:
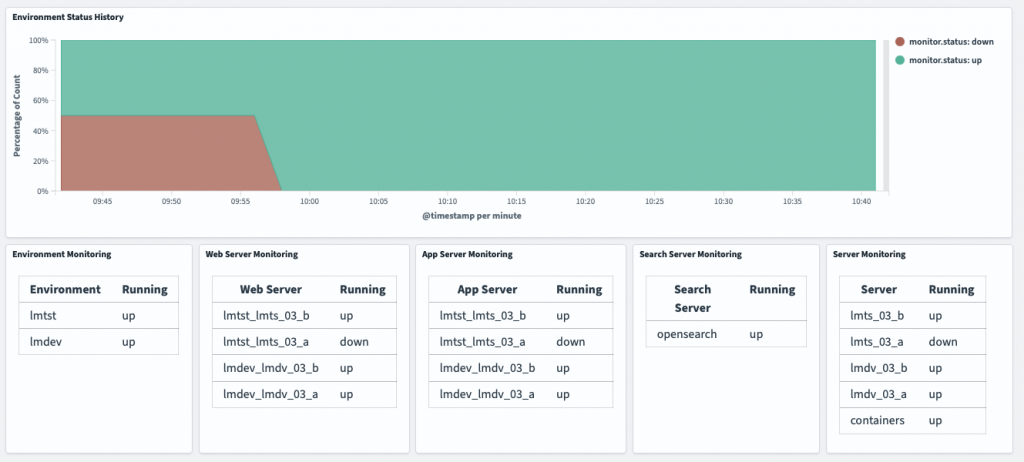
This is a quick way to check on your PeopleSoft resources and get information about each environment’s uptime and availability.
This is absolutely brilliant! Many thanks for sharing!!
Hi Dan,
Thanks for this post, very useful. If I have an API endpoint that produces a large dataset in JSON format, would I be able to import it into PeopleSoft? Is it easy enough to set it up?
Pingback: #339 – Uptime Monitoring
Hi Dan (great name too),
I was just curious why you chose to run heart throuh the container podman-compose?
To be honest I’d never heard of this container before. Are you a linux shop?
In my situation we are a windows shop and so will try this with the native windows dowload of heartbeat. I will more than likely also have to deal with certs also as both ES and Kibana are SSL.
But I am very excited to give this s try.
Thanks for another great share.
Cheers, Dan
Hi Dan – I’m moving anything non-PeopleSoft to running containers these days, so that’s why I picked podman-compose to run Heartbeat. I already had an Opensearch cluster running with podman-compose so it only made sense to add the Heartbeat container to the compose file. Over time I’d like to move these into a full Kubernetes cluster, but for now podman works well.
Hi Dan,
I was able to get opensearch-dashboards running after following your “Rootless Podman on Oracle Linux” example. Then I tried to follow your “Monitoring PS Uptime with Heartbeat”. However, heartbeat index was not created in opensearch instance after executing
$ podman-compose up -d && podman-compose logs -f heartbeatman-compose logs -f heartbeat
log is showing following ERROR:
b80261f16a85 javax.net.ssl.SSLHandshakeException: Received fatal alert: bad_certificate
b80261f16a85 at sun.security.ssl.Alert.createSSLException(Alert.java:131) ~[?:?]
b80261f16a85 at sun.security.ssl.Alert.createSSLException(Alert.java:117) ~[?:?]
b80261f16a85 at sun.security.ssl.TransportContext.fatal(TransportContext.java:365) ~[?:?]
b80261f16a85 at sun.security.ssl.Alert$AlertConsumer.consume(Alert.java:293) ~[?:?]
b80261f16a85 at sun.security.ssl.TransportContext.dispatch(TransportContext.java:204) ~[?:?]
b80261f16a85 at sun.security.ssl.SSLTransport.decode(SSLTransport.java:172) ~[?:?]
b80261f16a85 at sun.security.ssl.SSLEngineImpl.decode(SSLEngineImpl.java:736) ~[?:?]
b80261f16a85 at sun.security.ssl.SSLEngineImpl.readRecord(SSLEngineImpl.java:691) ~[?:?]
b80261f16a85 at sun.security.ssl.SSLEngineImpl.unwrap(SSLEngineImpl.java:506) ~[?:?]
b80261f16a85 at sun.security.ssl.SSLEngineImpl.unwrap(SSLEngineImpl.java:482) ~[?:?]
b80261f16a85 at javax.net.ssl.SSLEngine.unwrap(SSLEngine.java:679) ~[?:?]
b80261f16a85 at io.netty.handler.ssl.SslHandler$SslEngineType$3.unwrap(SslHandler.java:309) ~[netty-handler-4.1.100.Final.jar:4.1.100.Final]
b80261f16a85 at io.netty.handler.ssl.SslHandler.unwrap(SslHandler.java:1441) ~[netty-handler-4.1.100.Final.jar:4.1.100.Final]
b80261f16a85 at io.netty.handler.ssl.SslHandler.decodeJdkCompatible(SslHandler.java:1334) ~[netty-handler-4.1.100.Final.jar:4.1.100.Final]
b80261f16a85 at io.netty.handler.ssl.SslHandler.decode(SslHandler.java:1383) ~[netty-handler-4.1.100.Final.jar:4.1.100.Final]
b80261f16a85 at io.netty.handler.codec.ByteToMessageDecoder.decodeRemovalReentryProtection(ByteToMessageDecoder.java:529) ~[netty-codec-4.1.100.Final.jar:4.1.100.Final]
b80261f16a85 at io.netty.handler.codec.ByteToMessageDecoder.callDecode(ByteToMessageDecoder.java:468) ~[netty-codec-4.1.100.Final.jar:4.1.100.Final]
b80261f16a85 at io.netty.handler.codec.ByteToMessageDecoder.channelRead(ByteToMessageDecoder.java:290) ~[netty-codec-4.1.100.Final.jar:4.1.100.Final]
b80261f16a85 at io.netty.channel.AbstractChannelHandlerContext.invokeChannelRead(AbstractChannelHandlerContext.java:444) [netty-transport-4.1.100.Final.jar:4.1.100.Final]
b80261f16a85 at io.netty.channel.AbstractChannelHandlerContext.invokeChannelRead(AbstractChannelHandlerContext.java:420) [netty-transport-4.1.100.Final.jar:4.1.100.Final]
b80261f16a85 at io.netty.channel.AbstractChannelHandlerContext.fireChannelRead(AbstractChannelHandlerContext.java:412) [netty-transport-4.1.100.Final.jar:4.1.100.Final]
b80261f16a85 at io.netty.channel.DefaultChannelPipeline$HeadContext.channelRead(DefaultChannelPipeline.java:1410) [netty-transport-4.1.100.Final.jar:4.1.100.Final]
dcb08b4f775b 2023-11-14T18:35:53.151Z ERROR [publisher_pipeline_output] pipeline/output.go:154 Failed to connect to backoff(elasticsearch(https://opensearch-node1:9200)): Get “https://opensearch-node1:9200”: dial tcp 10.89.0.2:9200: connect: connection refused
Any suggestion for resolving above error? Please advise.
Thanks,
James
Hey Dan,
I was able to setup monitors successfully using Docker images of Elasticsearch, Kibana, Heartbeat from its website.
Thank you for the insightful sample monitors shared in your post.
PeopleSoft Process Scheduler is different from others and I wonder if there is a workaround for Heartbeat to monitor Process Monitor.
Thanks,
James
Hi James – glad to hear you got it all working!
When I built this setup, I purposefully ignored the process schedulers because I was more concerned with monitoring general availability of the system (e.g, can users log in a enter time/view paycheck?). Making sure the schedulers are active is important, but they don’t affect the way I was looking at measuring uptime.
The other issue with monitoring the schedulers is that they don’t start a process that listens on a port (unlike the JSL/JSH), so there is not port to check. If you have Remote Monitoring enabled (for the Health Center), there will be a JMX process (
rmiregistry) that runs alongside the domain. The issue with checking that process is it can be running when the domain is down so you can’t do a simple tcp connection test.rmiregistrydoes return JMX data if you wanted to go down that route.If you come up with something, I’d love to hear what you did!
dan
Hi Dan – thanks for the response.
Thanks again for showing how to monitor PeopleSoft using heartbeat approach, which is especially valuable with the example for monitoring user login from PIA. Over the years t I’d dealt with PPM, PHC, OEM plugin for PeopleSoft, which mostly show CPU/memory usages and server up/down status, not much practical values for customers, because they could not detect user login failure due to malfunctioning runaway webservers or appservers, not to mention the big efforts associated with setting up PPM, PHC, OEM.
For heartbeat to monitor Process Scheduler, I wonder if HTTP POST can be used to query PeopleSoft table.
Thanks again,
James
Hi Dan,
I wonder if PSQuery can be used for heartbeat to monitor status for Process Scheduler. For example, PSQuery PRCS_STATUS is created with SQL
SELECT A.SERVERSTATUS
FROM PSSERVERSTAT A
WHERE ( A.SERVERNAME = ‘PSUNX’)
URL
http://hr92u047.jca.com:8000/psc/ps/EMPLOYEE/ERP/q/?ICAction=ICQryNameURL=PRIVATE.PRCS_STATUS
would return value of SERVERSTATUS (3=running; 1=down). Is there a way for heartbeat monitor to evaluate the value of SERVERSTATUS and report its status?
Please advise.
Thanks,
James
Hi Dan,
I am able to setup an http monitor for Process Scheduler by running PSQuery using REST Web Service.
Thanks,
James